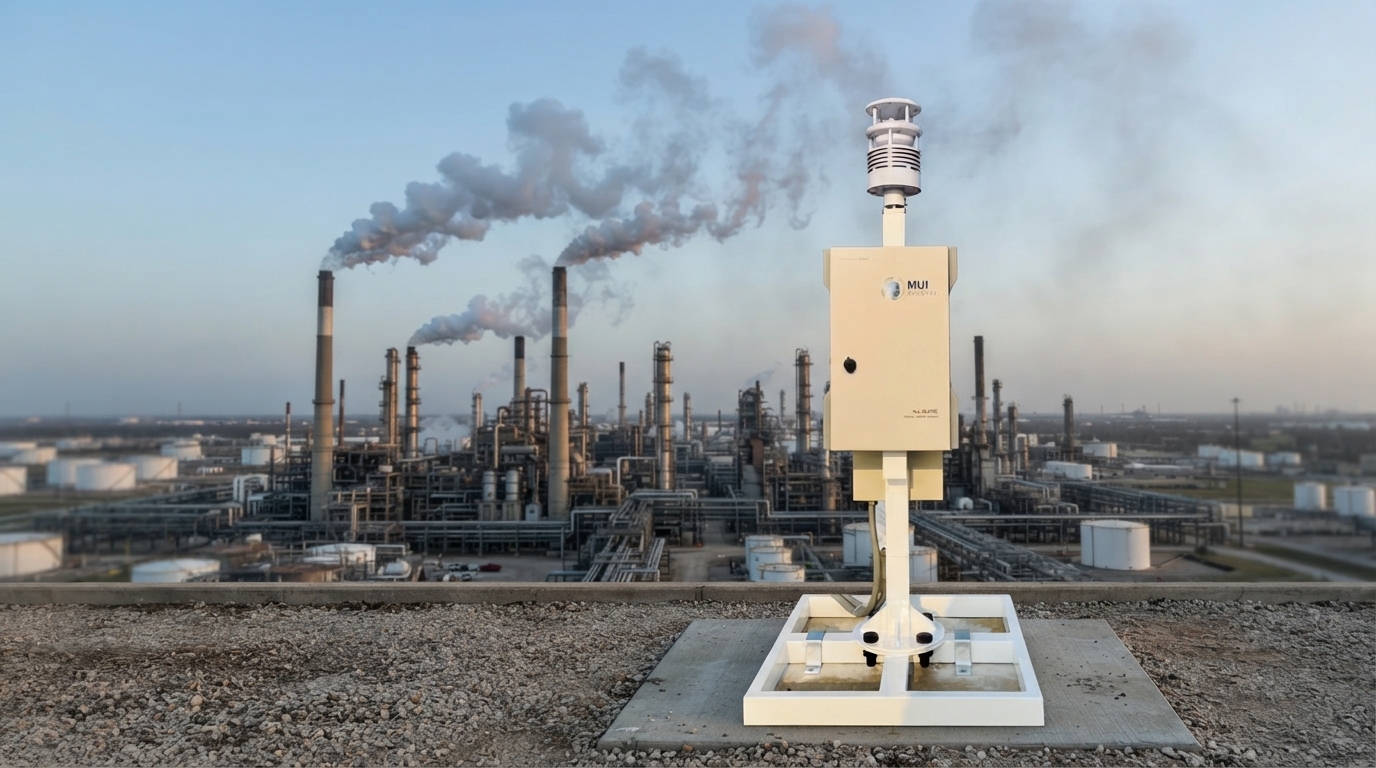



Field odor monitoring sensor network integrated with AI-driven Odor Fingerprint analysis for precise source identification and complaint reduction.
When the complaint arrives, who has the evidence?
On the day a local health officer walks in with a complaint, the complainant usually has a record of when the odour arrived, how strong it was and how often it recurred. The plant usually has a stack test from months ago that does not overlap the complaint window at all. That asymmetry is why plants lose the argument before they begin making it.
RE-VEAL installs a network of multi-parameter gas sensors running continuously around the clock, processes the combined response of several sensors to build an odour signature unique to each source, and ties every event to the wind at that moment. The result is a dataset that shows which events were genuinely the plant’s and which were not.
Questions this system answers with data
- Which direction did last night’s complaint come from, and which process was running at that time?
- In a multi-plant area, whose process does the detected signature match?
- How often do odour events actually occur, and at which hours of the day?
- If the wind is turning towards the community, should a process be held back?
- Did last quarter’s abatement investment actually reduce events — measurably?
Two odour regimes a Thai plant must satisfy at once
The costliest misconception among operators is that there is a single odour limit. There are two separate legal tracks, in different units, measured by different methods, enforced by different authorities. A plant compliant under one can still be ordered to act under the other.
| Aspect | Ministry of Industry track | Ministry of Public Health track |
|---|---|---|
| Legal basis | Ministerial Regulation on Odour Standards in Air from Factories B.E. 2568 | Public Health Act B.E. 2535, Chapter 5, Section 25 — nuisance |
| Where measured | Fence line and stack | At the affected receptor |
| Unit | Odour units | D/T (dilution to threshold) |
| Limits | 15 or 30 at the fence line; 300, 1,000 or 2,500 at the stack, by category and location | Below 2 or below 4, by type of premises |
| Method | Sensory analysis, triangular odour bag sampling | Field measurement with a Scentometer or Nasal Ranger |
| Who inspects | Department of Industrial Works, Pollution Control Department | Public health officers of the local administrative authority |
| Trigger | Scheduled oversight or permit conditions | Immediately upon a complaint |
Nuisance odour limits under the public health track
Set by the Public Health Committee Recommendation on criteria and methods for inspecting odour nuisance from businesses hazardous to health, B.E. 2560.
| Type of premises | Nuisance odour level (D/T) |
|---|---|
| Premises requiring special health protection — hospitals, schools, childcare centres, facilities for the elderly, convalescents or persons with disabilities | Below 2 |
| General premises — dwellings and communities | Below 4 |
If a measurement at any moment reaches those values, the odour is deemed a nuisance that may harm health or disturb the normal well-being of residents. "At any moment" is the operative phrase: a good annual average is no defence if a single period exceeds the limit.
| Why this matters: Department of Health statistics compiled over 2016–2017 record odour nuisance from businesses hazardous to health as the single most complained-about issue, and an inspection under this track can begin the moment a complaint is filed — no inspection cycle required. This is the route by which plants are most often caught unprepared. |
|---|
Why several parameters, not one
Human sensitivity varies enormously between compounds. These are the concentrations at which people begin to perceive an odour at all.
| Odorant | Approximate detection threshold | Typically from |
|---|---|---|
| Ethyl mercaptan | about 1 ppb | LPG odorisation, chemical processes |
| Methyl mercaptan | about 2 ppb | Tanneries, pulp and paper, decaying matter |
| Hydrogen sulphide (H₂S) | about 5 ppb | Wastewater treatment, landfill, livestock |
| Ammonia (NH₃) | about 1,100 ppb | Farms, manure drying yards, rubber, fertiliser |
Ammonia must be roughly 500 times more concentrated than mercaptan before anyone smells it. A system built around a single ammonia sensor can therefore miss the entire class of odours that actually generates complaints. That is the technical reason for a multi-sensor array — not an upsell.
The four levels of human response to odour
| Level | Meaning |
|---|---|
| DT — detection threshold | An odour is perceived, but not yet identifiable |
| RT — recognition threshold | The odour becomes identifiable |
| AT — annoyance threshold | The odour becomes annoying — this is where complaints originate |
| HST — health symptom threshold | Symptoms begin: irritation, headache, dizziness, nausea, itching |
Complaints arise at AT, well below the level at which health effects begin. Arguing that "the measured value is below the hazardous level" has never resolved a dispute, because nuisance law measures disturbance, not toxicity.
What is installed
- Fence-line and in-community monitoring stations — indicator gases chosen to match the actual process: hydrogen sulphide for wastewater treatment and decay, ammonia for farms and rubber, methyl mercaptan for the rotting-cabbage note, and total VOCs for coating and solvent work.
- Co-located wind data — wind speed and direction measured at the sensor, not pulled from a distant met station, because every official odour assessment method works from the downwind position.
- Odour signature analysis — the combined response pattern across sensors forms a signature specific to each source (treatment pond, animal housing, drying process, incinerator stack), against which detected events are matched.
- Wind back-trajectory — when a community station registers an event, the system computes backwards along the wind field for that period to identify the direction of origin.
- Calibration against the reference method — parallel samples analysed periodically by triangular odour bag, establishing the relationship between sensor response and true odour concentration for that site specifically. This relationship does not transfer between sites.
- An auditable record — every event carries time, position, wind direction and measured value, in a form that transfers directly onto official record forms.
- Dashboard and alerting — full event history, plus advance warning when the wind begins carrying from the process area towards the community.
Where sensor systems sit within Thai law
Clause 8 of the Ministerial Regulation B.E. 2568 requires odour concentration to be determined by sensory analysis, and allows other methods only once the Minister publishes criteria — which has not yet happened. Sensor arrays and electronic noses therefore cannot yet stand as a legal determination.
RE-VEAL says so before quoting, and deploys the system where it is strongest and where the law raises no objection.
| What continuous surveillance does well | What only the legal method can do |
|---|---|
| Detect minute-scale odour episodes that periodic sampling misses | Produce the odour concentration compared against the 15, 30, 300, 1,000 or 2,500 unit limits |
| Attribute direction of origin through back-trajectory analysis with wind data | Produce a value that stands before the Department of Industrial Works or the Pollution Control Department |
| Correlate odour events with operating logs to find the real cause | Produce the D/T value a local health officer uses to determine nuisance |
| Give advance warning when the wind turns towards the community | Provide evidence for litigation or formal defence |
| Demonstrate whether an abatement investment actually worked | Certify that the site complies with the law |
RE-VEAL performs the reference-method work in the right-hand column as well, so the client does not need two contractors.
Why the record must exist before the complaint
The Department of Health inspection procedure begins by taking the complainant’s account: the type and character of the odour, the symptoms experienced, and the timing, duration and frequency of exposure. That account determines where and when officers will measure. Where the complainant cannot specify the timing, impacts are logged continuously beforehand as part of the procedure.
The complainant therefore arrives with an hour-by-hour record while most plants have nothing of their own to set against it. Continuous surveillance is what gives the plant its own dataset over the same period, and the ability to separate its own events from everyone else’s.
| Worth knowing: Odour inspectors must be on a registered roster and must have no conflicting interest. Field measurement uses at least two Scentometer or Nasal Ranger units together with wind speed and direction instruments. Knowing in advance what they will measure with, where, and against which limit is what makes preparation targeted rather than speculative. |
|---|
Deliverables
- System design report: station locations, the rationale for each indicator gas against the actual process, and installation drawings.
- Installed and commissioned monitoring network with a dashboard available at all times.
- Baseline report from the initial data collection period, against which abnormal events are judged.
- The set of odour signatures for sources on and around the site, with an explanation of which process each corresponds to.
- Monthly odour event report: time, wind direction, detection point, and back-trajectory result.
- Calibration results against the triangular odour bag method, with the site-specific correlation and its uncertainty range.
- Exportable raw data in a form that transfers directly onto official record forms or into a formal response.
- Alert configuration, and training for the client’s own team to read and act on the data.
Process and schedule
| Phase | Activity | Indicative duration |
|---|---|---|
| 1 · Survey and design | Site survey, source and indicator-gas selection, station and wind-sensor siting | 1–2 weeks |
| 2 · Installation and commissioning | Install stations, connect telemetry, test operation, configure dashboard | 2–3 weeks |
| 3 · Baseline and signature building | Continuous data collection for baseline, signature training per source, parallel sampling for calibration | 4–8 weeks |
| 4 · Ongoing surveillance | Monthly event reporting, signature model tuning, scheduled recalibration | Per service agreement |
Roughly two to three months from start to a usable signature set. Phase 3 cannot be shortened: it has to span enough variety in wind and operating conditions. Any supplier claiming the system works the day it is installed has skipped it.
Limitations we state before quoting
- Sensor readings are not a legal result. Until the Minister publishes criteria under Clause 8, values compared against the limits must come from sensory analysis.
- Chemical sensors respond across compounds. Readings suit trend analysis and self-comparison better than absolute interpretation; RE-VEAL always states the uncertainty range.
- Thai humidity affects readings, and points with high hydrogen sulphide — directly above an inlet tank, for instance — need dilution or protection designed in, or sensors degrade abnormally fast.
- Sensors drift over long deployments. A recalibration cycle belongs in the contract; install-once-and-forget is not a viable design.
- Odour signatures are site-specific. A signature set trained at one plant does not transfer to another; it must be rebuilt each time.
The technology is still on its way into formal standardisation: the European air quality standards committee established a working group on instrumental odour monitoring systems in 2015 and the work is not yet complete, while the international reference method remains sensory analysis by a human panel under EN 13725, reported in ou_E/m³.
Who this service is for
- Plants already facing community odour complaints that need their own evidence to respond
- Industrial estates and dense operating areas where the dispute is over which site is actually responsible
- Livestock farms, poultry houses and agro-industrial processing plants
- Solid waste management centres, landfills and central wastewater treatment plants
- Businesses hazardous to health in the four categories of the B.E. 2560 recommendation: pets and livestock, animals and animal products, food, and agriculture
- Plants about to invest in odour abatement that want the before-and-after measured, not assumed
- Local authorities needing neutral evidence to mediate a dispute
Commonly combined with
- Odour concentration testing by triangular odour bag method — for values that stand legally, and to calibrate the sensor network.
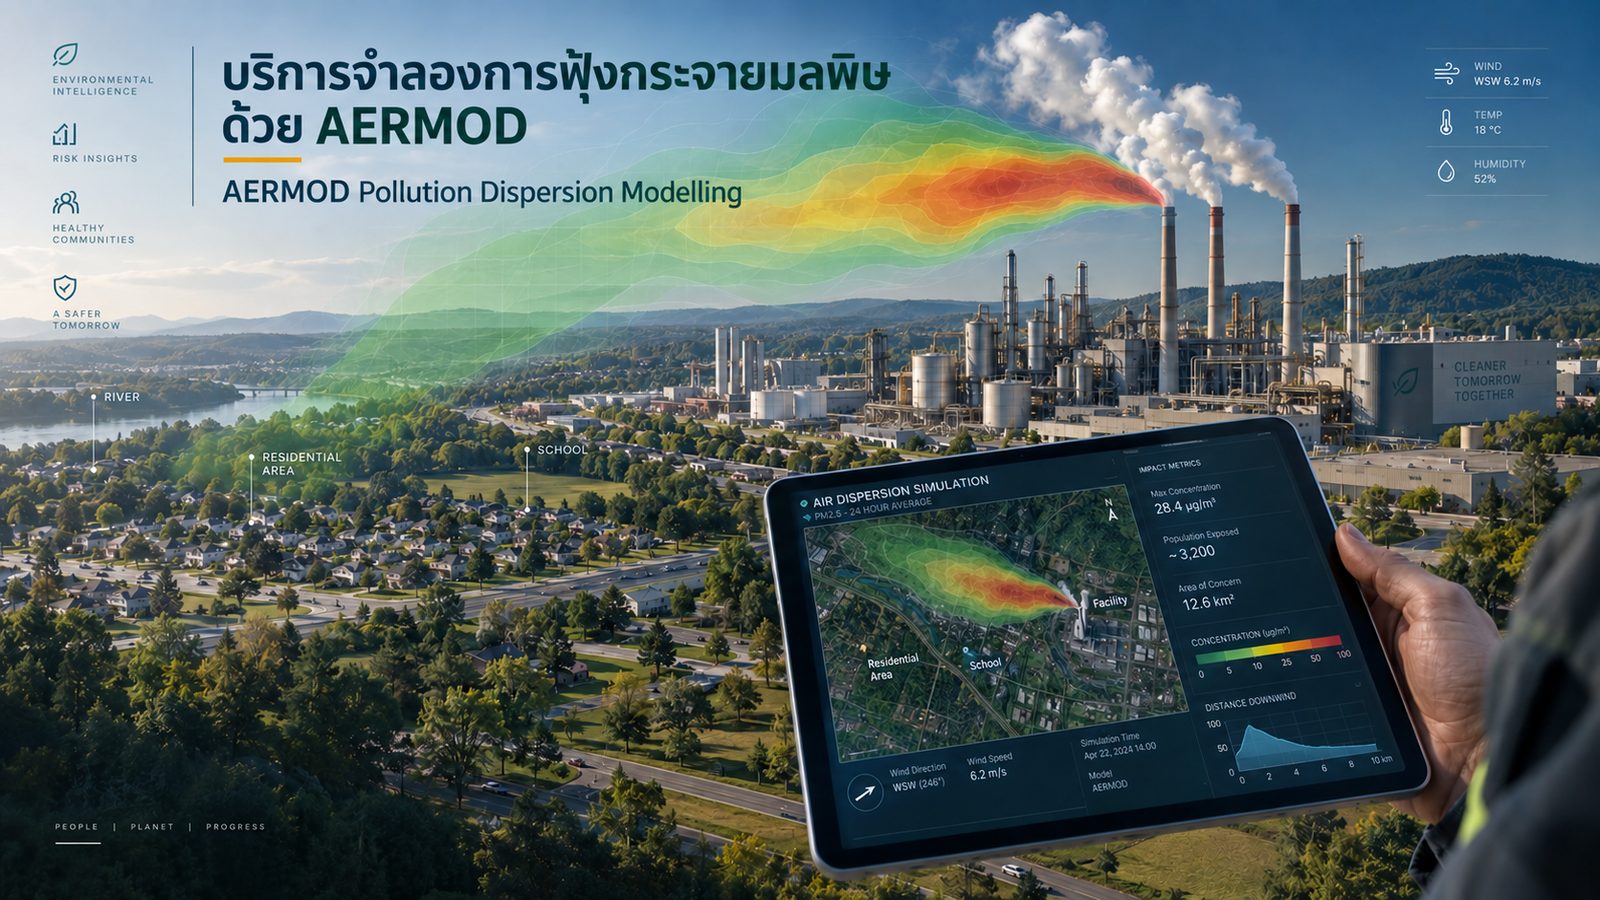
- AERMOD dispersion modelling — to predict ahead and rank which source to abate first, while the monitoring network confirms what actually happened. The two cross-check each other.
Getting started
Send us the basics: type of operation, the character of the odour complained about, and the distance to the nearest community. Our team will assess which gases to monitor and how many stations are needed, and return a fee proposal and schedule within three working days, at no cost at that stage.
Free initial consultation · Request a proposal