

Design, installation, verification and ongoing care of stack continuous emission monitoring systems under the Ministry of Industry Notification B.E. 2565, with the data link to the Department of Industrial Works, a US EPA-based quality assurance plan, and an early-warning dashboard that shows the plant the trend before a value reaches the limit.
Your stack data reaches the regulator every hour. You need to see it first.
Since the Ministry of Industry Notification on the installation of special instruments to report air pollution from factory stacks, B.E. 2565, came into force, stack emissions from more than 600 large plants in 13 categories no longer live in an annual report. They stream in real time into the Department of Industrial Works (DIW) and are open to the public through the POMS application. The moment a value spikes, the inspector and the community see it at the same time as the plant, and sometimes earlier.
The problem RE-VEAL meets most often is not a plant exceeding its limit. It is a plant whose CEMS was installed but never made defensible: data gaps, readings skewed by a blocked sample line, no calibration records, or values converted to reference conditions incorrectly. The numbers that reach the regulator look like exceedances while the process is running normally, and the plant has no data of its own to argue with.
So this service is not about selling analysers. It is the design, installation, verification and ongoing care of a continuous emission monitoring system whose reported data holds up, together with a plant-side dashboard and alerts that show the trend before a value touches the limit.
Questions this system answers with data
- From which hour did stack dust or gas start climbing toward the limit, and which fuel change or production load did it coincide with?
- Was last night's apparent exceedance a real emission, or a calibration, maintenance, start-up or shutdown period that the rules allow to be flagged separately?
- Has this month's data reached DIW for the required share of operating hours, and what caused any gaps?
- How much did the air pollution control system you invested in actually reduce at the stack, before versus after, in numbers?
- If asked to explain, are the verification and calibration records complete for every required cycle and ready to submit?
Who must install, and what must be measured
The B.E. 2565 Notification took effect on 10 June 2566 (2023). New or expanding plants must complete installation before starting operation; existing plants had until 9 June 2567 (2024). Notification No. 2, B.E. 2567, then allowed plants that could not meet that date to be given a new deadline, but no later than 31 December 2568 (2025), except for the production units and sizes in item 6 of the schedule, which may run to 31 December 2570 (2027). In practice the main grace periods have now expired, and a covered plant without a system is out of compliance. The parameters depend on plant type and include opacity, particulate matter, sulphur dioxide, nitrogen oxides, carbon monoxide, hydrogen sulphide, hydrogen chloride and mercury, together with oxygen, temperature and gas flow used to convert readings to reference conditions.
| Plant category covered | Size threshold | Typical required parameters |
|---|---|---|
| Power plants | 10 MW and above | Opacity or PM, SO₂, NOx, CO, O₂ |
| Boilers | 30 tonnes of steam per hour and above | Opacity or PM, SO₂, NOx, O₂ |
| Fuel-combustion process units | 100 MMBTU per hour and above | Opacity or PM, SO₂, NOx, O₂ |
| Steel and metal smelting | Per category and capacity in the Notification | PM, SO₂, NOx, CO |
| Refineries and petrochemicals | Per category in the Notification | PM, SO₂, NOx, CO, H₂S by process unit |
| Cement plants | Per category in the Notification | PM, SO₂, NOx, CO, O₂ |
| Pulp and paper mills | Per category in the Notification | PM, SO₂, NOx, H₂S |
| Acid and glass production | Per category in the Notification | PM, SO₂, NOx and process-specific values |
| Waste and hazardous-waste incinerators | Per category in the Notification | PM, SO₂, NOx, CO, HCl, mercury, O₂ |
| Plants whose EIA requires CEMS | Per the EIA measures | As specified in the measures |
This table is a summary. The binding categories and thresholds are those in the schedule attached to the Notification and in each plant's licence conditions, which RE-VEAL checks as the first step before any design work.
Parameters without CEMS must still be reported through POMS
Notification No. 2, B.E. 2567, replaced Clause 12 of the 2565 Notification. Plants under Clause 4 (1) and (2) and Clause 11 (3) must measure the pollutants for which CEMS is not mandated and report the results to DIW through the Pollution Online Monitoring System (POMS) every three months. A plant therefore needs a periodic testing plan for the remaining parameters alongside its CEMS, rather than treating installation as the end of the obligation.
Bangkok plants: the B.E. 2569 Notification extends the duty to boilers and furnaces of every size
The Ministry of Industry Notification on factories in Bangkok installing special instruments to report air pollution from stacks, B.E. 2569, was signed on 29 January 2569 (2026) and published in the Government Gazette on 12 February 2569. It responds to Bangkok's dust episodes from November to March each year. It took effect the day after publication, and plants already licensed before that date must comply by 1 October 2569. The Ministry estimates around 156 plants are covered, compared with only a handful in Bangkok under the 2565 Notification.
The Notification does not apply to plants already covered by the 2565 Notification, to items 1 to 3 of its schedule where the fuel is gas, or to electrically heated boilers. Installation, verification or calibration, and reporting follow Clauses 8, 9, 10, 11, 13, 14 and 15 of the 2565 Notification, so the technical standard is the same set.
| Item | Plant category and production unit covered | Parameters to measure |
|---|---|---|
| 1 | Category 88 (2), thermal power generation units | Opacity or PM, SO₂, NOx |
| 2 | All categories, boilers with fuel combustion | Opacity or PM, SO₂, NOx |
| 3 | All categories, production units with fuel combustion | Opacity or PM, SO₂, NOx |
| 4 | Category 57, cement: kiln and clinker cooler | Kiln: opacity or PM, SO₂, NOx · Clinker cooler: opacity or PM |
| 5 | Category 38, pulp: recovery furnace and lime kiln | Opacity or PM, SO₂, NOx |
| 6 | Category 59, primary iron and steel: smelting furnace, melting furnace and preheat process | Opacity or PM, SO₂, NOx |
| 7 | Categories 60 and 106, non-ferrous metals: smelting and melting furnaces | Opacity or PM, SO₂, NOx |
| 8 | Categories 60 or 106, lead smelting: melting furnace | Opacity or PM, SO₂, NOx |
| 9 | Category 101, municipal waste incinerators and infectious waste incinerators | Opacity or PM, SO₂, NOx |
| 10 | Category 42 and any plant with a sulphuric acid production unit, excluding repackaging | SO₂ |
| 11 | Category 54, glass, glass fibre and glass products: heat-fired melting furnaces | Opacity or PM, SO₂, NOx |
At about the same time the Ministry of Industry announced, jointly with the Bangkok Metropolitan Administration, tighter stack particulate limits for Bangkok plants from 1 July 2569: no more than 60 mg/m³ for gaseous fuel and 90 mg/m³ for solid and liquid fuel. CEMS values reported by Bangkok plants will be judged against these limits, not the general B.E. 2549 values.
The limits results are benchmarked against
Stack emission limits for general factories follow the Ministry of Industry Notification on the quantity of contaminants in air discharged from factories, B.E. 2549, which sets values by process and fuel. Some categories, including power plants, refineries, waste incinerators and cement plants, have their own stricter notifications. The values below are the general B.E. 2549 limits, to show the order of magnitude.
| Pollutant | General limit where no specific notification applies | Note |
|---|---|---|
| Particulate matter (TSP) | 400 mg/m³ | Combustion processes have lower fuel-specific limits for fuel oil, coal and biomass |
| Sulphur dioxide (SO₂) | 500 ppm | Combustion processes set separately by fuel |
| Nitrogen oxides (NOx as NO₂) | 200 ppm | Coal and some processes have specific values |
| Carbon monoxide (CO) | 690 ppm | — |
| Hydrogen sulphide (H₂S) | 100 ppm | — |
| Hydrogen chloride (HCl) | 200 mg/m³ | Waste incinerators have a specific notification |
Every limit is defined at reference conditions: 25 °C, 760 mmHg, dry basis, and for combustion processes corrected to 50 percent excess air, equivalent to 7 percent oxygen. A raw analyser reading cannot be compared with the limit until it has been converted correctly.
An "installed" CEMS versus a "verifiable" CEMS
The B.E. 2565 Notification requires CEMS to be verified and calibrated by the methods of the United States Environmental Protection Agency, meaning the requirements of 40 CFR Part 60: Appendix B for certifying the system at installation, and Appendix F for quality assurance during operation. DIW began studying alternative verification methods in 2567 (2024) to reduce the burden on operators, but until a notification adopts them, this is the set that inspectors work from.
| Test | When | What it involves |
|---|---|---|
| 7-day calibration drift | At system certification after installation | Zero and span gas injected daily for seven consecutive days; drift must stay within the performance specification for each parameter |
| Relative Accuracy Test Audit (RATA) | At certification and at least once a year thereafter | CEMS readings compared with simultaneous reference-method stack tests, at least nine runs, by a registered third-party test team |
| Cylinder Gas Audit (CGA) | Quarterly, in quarters without a RATA | Certified reference gases at two concentrations injected to check analyser accuracy |
| Daily zero and span check | Every operating day | Automated and logged; if drift exceeds the limit the system is out of control and that period's data is invalid |
Many plants pass the tests at installation and then record nothing afterwards. When a reported value is questioned, there is no evidence that the analyser was reading correctly that day. RE-VEAL builds every one of these cycles into the service agreement, with a record file that can be submitted immediately.
What is installed
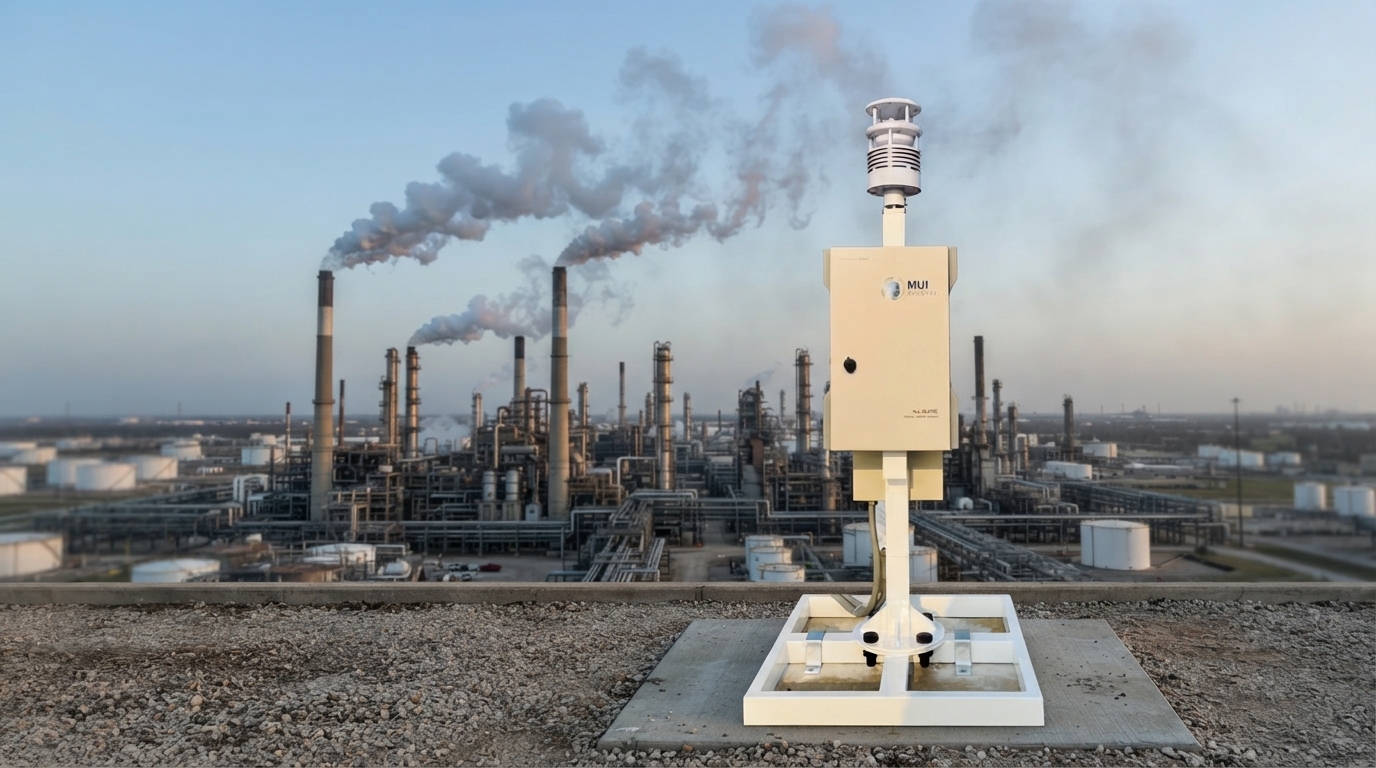
- Gas analysers — extractive systems that draw the sample through conditioning before analysis, or in-situ systems measuring directly in the stack, chosen according to stack geometry, moisture, temperature and the required parameters. Analysers must carry international certification such as US EPA, TÜV or MCERTS.
- Particulate or opacity monitor — the measurement principle must suit the stack. A wet stack downstream of a scrubber, saturated with water vapour, cannot use a standard opacity monitor and needs a particulate monitor designed for wet gas.
- Oxygen, temperature and flow measurement — used to convert readings to reference conditions and to calculate mass emission rates where a licence requires them.
- Sampling and conditioning train — probe with filter, heated line to prevent condensation, chiller to remove water, and pump. This is where most CEMS fail, not at the analyser.
- Data acquisition and handling system (DAHS) — computes averages, applies reference-condition corrections, tags calibration and maintenance periods separately from normal operation, and tracks data completeness automatically.
- Data link to DIW — in the format and at the frequency DIW specifies, with local buffering when the connection drops and back-filling when it returns.
- Plant dashboard and alerts — current values, hourly and daily trends, transmission status, and multi-level alerts before the limit, delivered on screen, by email and via LINE.
- Backup power and climate-controlled enclosure — analysers in a cabinet above 40 °C drift and fail early; the enclosure has to be designed for Thai conditions.
Why the plant needs its own dashboard when the data already goes to the regulator
DIW's system is built for oversight, not for running a plant. It tells you a limit has been exceeded. It does not tell you that it will be exceeded in two hours, or why.
The RE-VEAL dashboard sets early-warning levels as fractions of the limit, for example 70 and 85 percent, and links them to whatever process data the plant chooses to connect, such as boiler load or fuel type. The operations team sees why a value is climbing and has time to act before the hourly average reaches the limit. The system also tracks data completeness cumulatively by day and by month, so the plant knows in advance whether it will meet DIW's required share of operating hours, rather than finding out at month end.
Most importantly, every high-value period carries its context: calibration, maintenance, start-up or shutdown, or normal operation. That is the difference between receiving an order and being able to respond with evidence.
CEMS and odour testing are separate obligations whose sampling ports should be designed together
CEMS measures parameters with numeric limits. Odour concentration under the Ministerial Regulation on Odour Standards in Air from Factories, B.E. 2568, is still determined by sensory analysis, so a plant with CEMS is not automatically compliant on odour. CEMS data does help odour work in three ways: the continuous operating record answers whether the abatement system was running normally when the community reported an odour; CEMS excursions often coincide with odour episodes because they share root causes; and the stack flow, temperature and moisture data are exactly what must be known before odour sampling at the stack and before dispersion modelling. When a complaint arrives, public health officers compile source data on the Department of Health's form Kor.3, and a plant holding a continuous record can answer in a single pass.
Pollution Control Department and DIW guidance sets explicit physical requirements for odour sampling ports at stacks. They are far cheaper to build in during CEMS installation than to retrofit by drilling the stack and adding a platform later.
| Item | Requirement for odour sampling at the stack |
|---|---|
| Sampling port location | Downstream of the point where process exhaust is collected and treated; sample drawn at the centre of the stack diameter |
| Safety | A stable, strong scaffold or platform with sufficient working area, shared with CEMS calibration and reference-method testing |
| Data required before sampling | Stack height, diameter, port position, and the moisture, temperature and pressure of the exhaust inside the stack, all of which CEMS already records |
| Moisture management | A moisture trap in the sampling line, since water vapour entering the sample bag ruins the sample |
| Collection and analysis | An odour-free pump at no less than 4 litres per minute, run for 1 to 3 minutes to collect about 8 litres, with analysis completed within 24 hours of sampling |
Deliverables
- Applicability review identifying which stacks are covered, which parameters must be measured and which limit notification applies, referenced to the Notification schedule and the plant's licence conditions.
- System design documentation for DIW approval, including sampling-point locations to specification, analyser selection and the data-link architecture.
- Installed, commissioned and certified CEMS with the 7-day calibration drift report and the RATA report from the third-party test team.
- Tested data link to DIW with documented confirmation of connection.
- Plant dashboard, multi-level alert configuration, and training for operations and environmental staff.
- Annual quality assurance plan covering quarterly CGA, annual RATA and preventive maintenance of the sampling train.
- Monthly summary report: averages, high-value events with context, data completeness and daily zero/span results, in a form suitable for submission.
Process and schedule
| Phase | Activity | Indicative duration |
|---|---|---|
| 1 · Applicability review and stack survey | Confirm plant category, parameters and applicable limits; survey stacks, sampling points, power and communications | 1–2 weeks |
| 2 · Design and DIW approval | Technology selection, design documentation, submission to DIW | 3–6 weeks including review time |
| 3 · Procurement and installation | Order analysers; install sampling points, enclosure, power and signal cabling | 8–14 weeks depending on analyser lead time |
| 4 · Commissioning and certification | Start-up, 7-day calibration drift test, RATA by third-party test team | 3–4 weeks |
| 5 · Data link and handover | Connect to DIW, configure dashboard and alerts, train staff | 1–2 weeks |
| 6 · Operation and quality assurance | Daily zero/span, quarterly CGA, annual RATA, preventive maintenance, monthly reporting | Per service agreement |
Roughly four to six months from start to a certified, connected system. The main variables are analyser lead time and the regulator's review cycle. Plants with several stacks should start with the highest-risk stack and extend in stages.
Limitations we state before quoting
- CEMS is a measuring instrument, not a control device. Installing it does not lower emissions; it shows what they are and where to act. A genuine exceedance has to be fixed in the process or the abatement system.
- RATA must be performed by a registered third-party test team. RE-VEAL coordinates and prepares the system, but the result belongs to the test team, not to the installer.
- Wet stacks after scrubbers, sticky dust, and gas concentrations very close to the detection limit require specialised technology and cost more than a standard system. We say so at the survey stage.
- The system needs continuous care. Filters, heated lines and chillers have service lives; without a maintenance cycle, data quality degrades within months while the screen keeps showing numbers.
- Verification rules may change. DIW is studying alternatives to the US EPA methods; when a new notification is issued, the quality assurance plan must be revised, which is covered in the service agreement.
Who this service is for
- Plants in the 13 categories of the B.E. 2565 Notification that have not yet installed CEMS, or have installed but not yet certified and connected it
- Plants with an existing CEMS whose data has gaps, whose readings are not trusted, or whose verification records are incomplete, and that want an operator accountable for data quality
- Plants whose EIA or licence conditions require continuous monitoring even outside the 13 categories
- Plants applying for capacity expansion or fuel change that must have CEMS in place before start-up
- Industrial estates and corporate groups wanting a consolidated dashboard across several plants on one standard
- Plants investing in new air pollution control equipment that want before-and-after numbers for management and the community
Commonly combined with
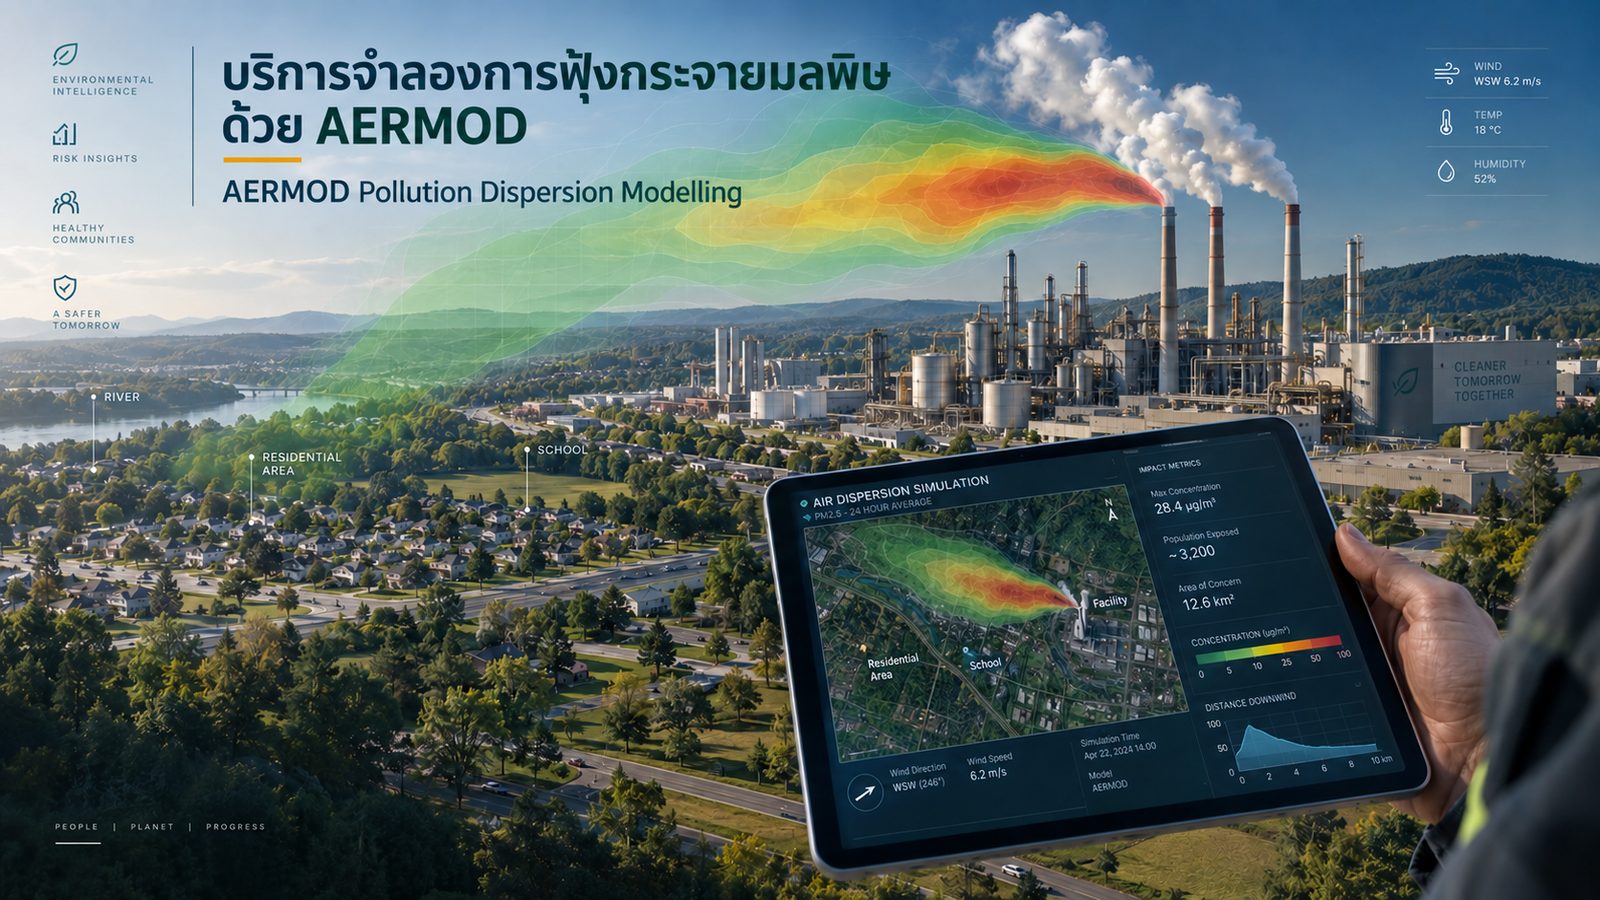
- AERMOD dispersion modelling — using actual emission rates from CEMS as model input instead of assumed values from an annual stack test, so the predicted community impact reflects real operation.
- Community air quality monitoring — with stack data, community data and wind direction together, the plant can answer whether that day's dust in the community came from its own stack.
- Odour fingerprint monitoring and source identification — for plants that face both stack emission questions and odour complaints from non-stack sources.
Getting started
Send us the basics: plant category per the licence, number and size of stacks, the fuel or process discharged, and the status of any existing CEMS. Our team will assess which stacks are covered, which parameters are required and which technology suits them, and return a fee proposal and schedule within five working days, at no cost at that stage.
Free initial consultation · Request a proposal
References
- Ministry of Industry Notification on factories installing special instruments to report air pollution from factory stacks, B.E. 2565 (in force 10 June 2023). Department of Industrial Works. https://www.diw.go.th/webdiw/a18042565-01/
- Ministry of Industry Notification on factories installing special instruments to report air pollution from factory stacks (No. 2), B.E. 2567. Government Gazette, Vol. 141, Special Part 215 Ngor, p. 10 (8 August 2024).
- Ministry of Industry Notification on factories in Bangkok installing special instruments to report air pollution from factory stacks, B.E. 2569. Government Gazette, Vol. 143, Special Part 41 Ngor, p. 52 (12 February 2026).
- Ministry of Industry Notification on the quantity of contaminants in air discharged from factories, B.E. 2549. https://dl.parliament.go.th/handle/20.500.13072/219466
- Ministerial Regulation Prescribing Odour Standards in Air from Factories, B.E. 2568. Government Gazette, Vol. 142, Part 21 Kor (27 March 2025).
- Public Relations Department (2023). Strict control of stack emissions from over 600 factories: CEMS mandated from 10 June 2023, with public participation through the POMS application. https://www.prd.go.th/th/content/page/index/id/102344
- Department of Industrial Works (2024). DIW studies alternative CEMS verification and calibration methods to reduce the burden on operators. https://www.diw.go.th/webdiw/pr67-282/
- MM Thailand (2026). 1 July 2026 deadline: 156 Bangkok factories under tighter control, with technology to cut PM2.5. https://www.mmthailand.com/bangkok-factories-pm25-control-cems-1-july-2026/
- U.S. Environmental Protection Agency. 40 CFR Part 60, Appendix B (Performance Specifications) and Appendix F (Quality Assurance Procedures). https://www.ecfr.gov/current/title-40/chapter-I/subchapter-C/part-60/appendix-Appendix%20F%20to%20Part%2060
- Pollution Control Department, Air Quality and Noise Management Division (2026). Lecture material: Odour measurement and control at factories and livestock facilities.
- Department of Industrial Works, Factory Pollution Research and Early Warning Division. Training material: Odour measurement and control in industry (Sonthaya Apamake).
- Department of Health, Bureau of Environmental Health. Technical manual: Guidelines for investigating odour nuisance for officers under the Public Health Act.