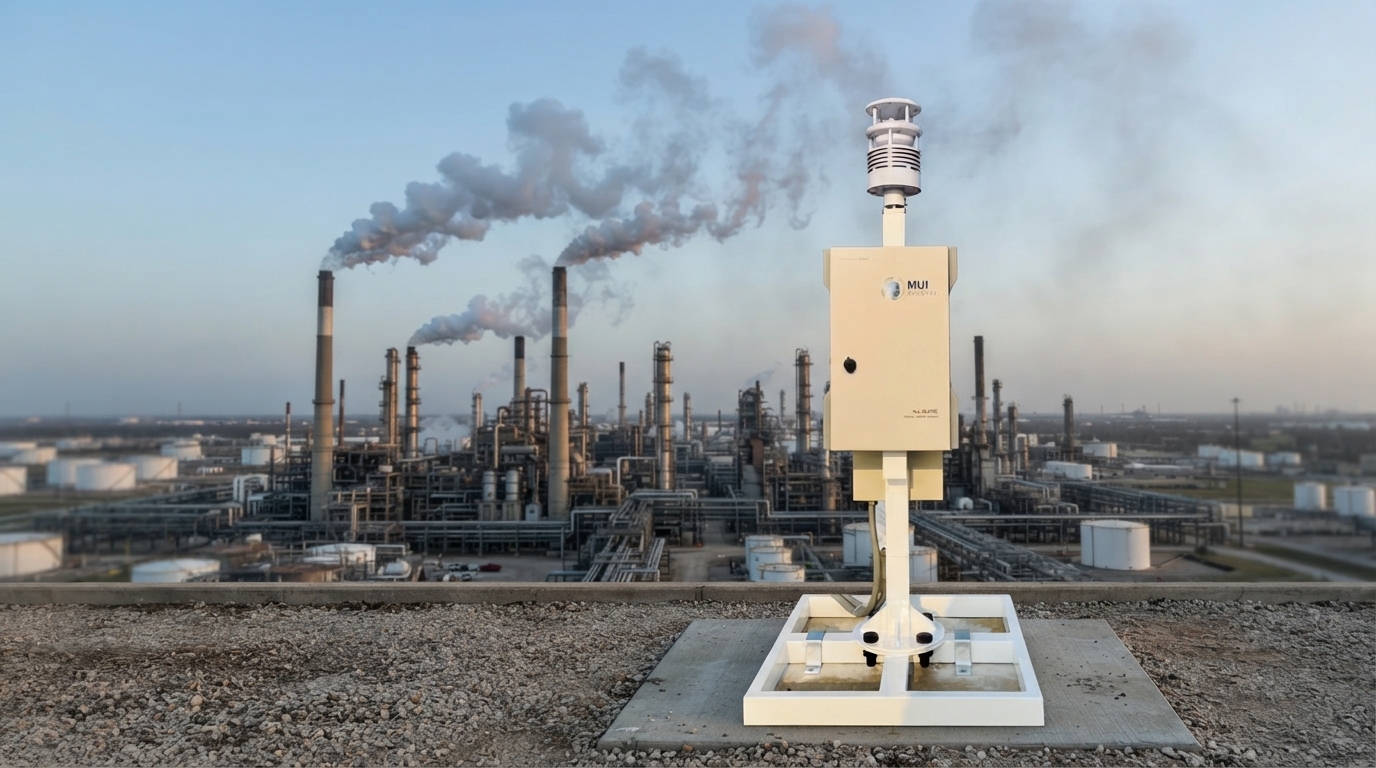

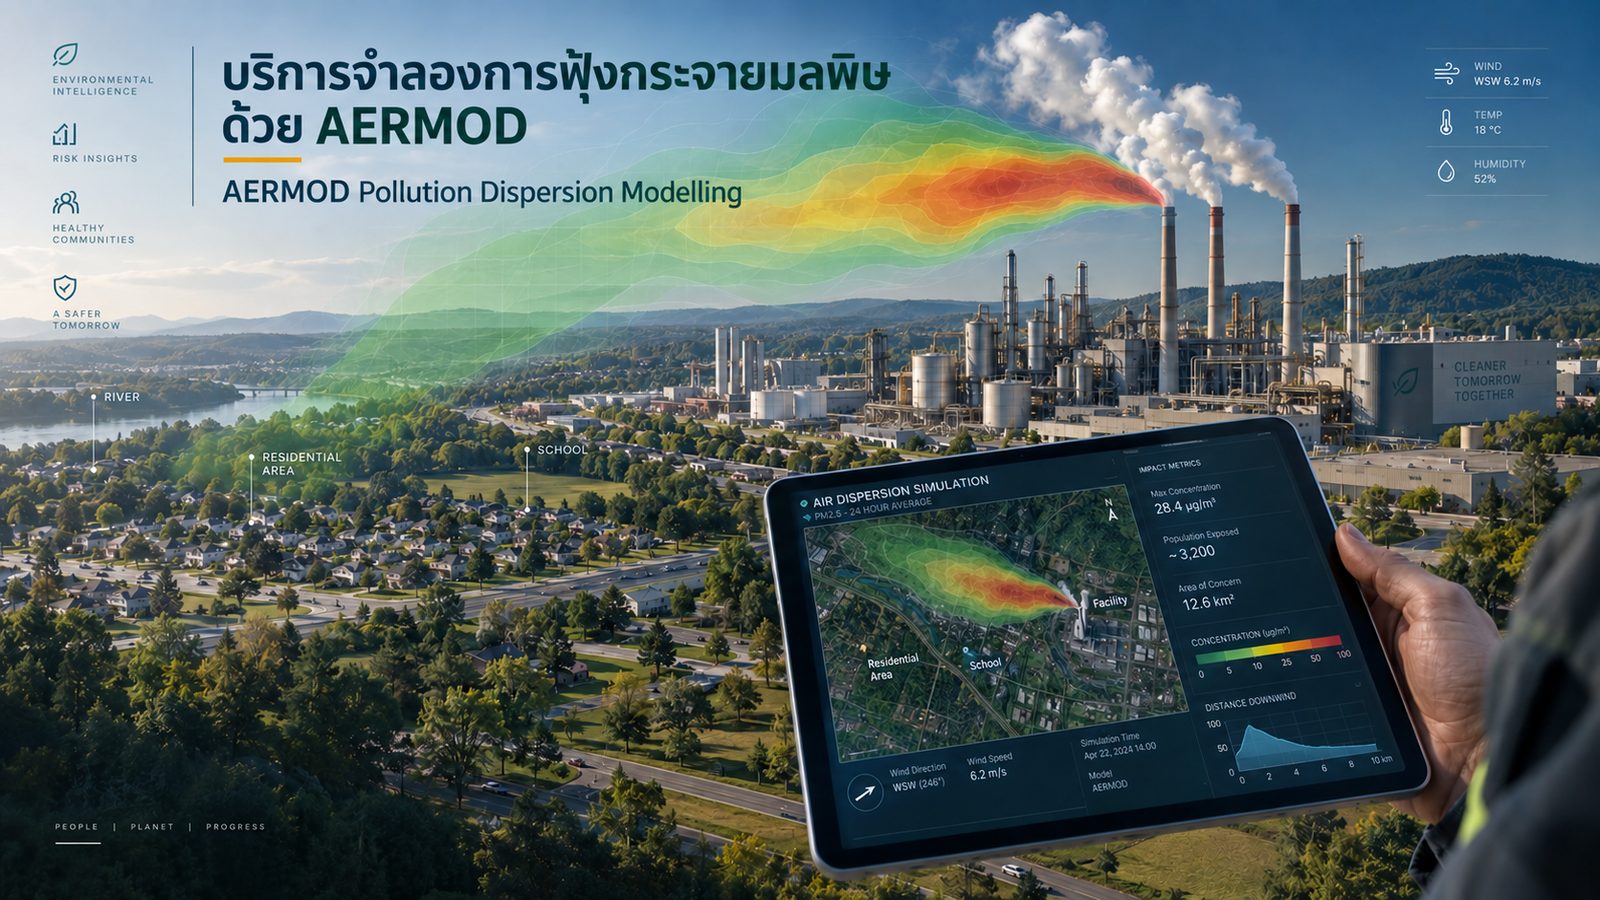

Professional atmospheric dispersion modelling using US EPA AERMOD to assess odor and air pollutant dispersion over surrounding communities.
Know where the plume lands before you build
When a plant raises output, adds a stack, installs a boiler or expands a treatment pond, the hard question is not how much is emitted but where it lands and what the neighbouring community receives. Waiting for complaints and fixing afterwards costs several times more than modelling it in advance, in fines, in retrofitting equipment already installed, and in the time lost to negotiation.
RE-VEAL models the dispersion of air pollutants and nuisance odour using AERMOD, the model designated as a preferred model under US EPA Appendix W and accepted in Thailand’s environmental impact assessment process. The output is a set of isopleth contour maps that identify which areas receive the highest concentrations, how high those concentrations are, and whether they exceed the statutory limits.
Questions we turn into numbers
- How much does the fence-line concentration rise if one more boiler is added?
- Is the 15-metre stack tall enough to escape the wake of the buildings around it?
- Is the treatment pond or the drying stack the source that actually drives the complaints?
- Which source, abated first, gives the best return on capital?
- Do the results exceed the B.E. 2569 ambient standards or the B.E. 2568 odour limits?
The limits every result is benchmarked against
A. Ambient Air Quality Standards, B.E. 2569
Signed by the National Environment Board on 6 January 2026, published in the Royal Gazette Vol. 143, Special Part 20 Ngor on 21 January 2026 and effective from the following day. It repeals the seven earlier notifications listed in Clauses 1.1 to 1.7 and consolidates them into a single instrument, prescribing the limits, the measurement methods and the measurement conditions.
| Pollutant | 1-hour | 8-hour or 24-hour | Annual |
|---|---|---|---|
| Sulfur dioxide (SO₂) | 100 ppb | 50 ppb (24 h) | — |
| Nitrogen dioxide (NO₂) | 120 ppb | — | 30 ppb |
| Carbon monoxide (CO) | 30 ppm | 9 ppm (8 h) | — |
| Ozone (O₃) | 100 ppb | 70 ppb (8 h) | — |
| Total suspended particulates, up to 100 µm (TSP) | — | 200 µg/m³ (24 h) | 80 µg/m³ |
| PM10 | — | 100 µg/m³ (24 h) | 50 µg/m³ |
| PM2.5 | — | 37.5 µg/m³ (24 h) | 15 µg/m³ |
| Lead (Pb) | — | 1 µg/m³ (monthly) | — |
Clause 3 also prescribes the accepted measurement methods, not merely the numbers. Measured data fed into the model must therefore come from a recognised method, or an otherwise sound result may not be accepted.
| Pollutant | Methods prescribed by the notification |
|---|---|
| Sulfur dioxide (SO₂) | Pararosaniline or ultraviolet fluorescence |
| Nitrogen dioxide (NO₂) | Chemiluminescence or cavity attenuated phase shift spectroscopy (CAPS) |
| Carbon monoxide (CO) | Non-dispersive infrared detection, or NDIR gas filter correlation |
| Ozone (O₃) | Chemiluminescence or ultraviolet absorption photometry |
| TSP | Gravimetric only; no equivalent method is listed |
| PM10 and PM2.5 | Gravimetric as the reference method; beta radiation attenuation, TEOM, light scattering and dichotomous air sampler accepted as equivalents |
| Lead (Pb) | Atomic absorption spectrometer |
Clause 4 permits reference or equivalent methods designated by the US EPA or the European Union, or any other method notified in the Royal Gazette by the Director-General of the Pollution Control Department.
The notification also sets measurement conditions: sampling height of 3 to 6 m above ground for the four gases, 1.50 to 6 m for TSP, PM10 and lead, and 1.50 to 15 m for PM2.5; concentrations referenced to 25 °C and 1 atmosphere, except PM2.5 which is referenced to actual ambient temperature and pressure; and data completeness of at least 75 per cent. These are the details that quietly disqualify a great deal of existing monitoring data.
B. Ministerial Regulation on Odour Standards in Air from Factories, B.E. 2568
This regulation repealed the B.E. 2548 instrument and expanded the schedule of controlled factories from 23 to 24 entries by adding natural-rubber factories as entry 23, with limits differentiated by location.
| Case | Fence line or site boundary | Stack |
|---|---|---|
| Entries 1–22 and 24, inside an industrial zone | ≤ 30 odour units | ≤ 1,000 odour units |
| Entries 1–22 and 24, outside an industrial zone | ≤ 15 odour units | ≤ 300 odour units |
| Entry 23, rubber factories, inside or outside an industrial zone | ≤ 30 odour units | ≤ 2,500 odour units |
| Animal husbandry premises, under the MNRE notification | ≤ 30 odour units | Not specified |
Clause 5 requires exhaust air to meet the limit and expressly forbids meeting it by dilution. That closes the option factories reached for most often: raising the exhaust flow or extending the stack so the measured value falls while the odour emission rate stays the same. Modelling therefore stops being a tool for finding a compliant stack height and becomes a tool for ranking which source to abate first.
Sources and pollutants covered
Classifying each source by its actual physical character is the step that decides how accurate the result will be. Forcing everything into a point source because it is easier to enter is the most common reason modelled results fail to match measured ones.
| Source type | Typical plant examples |
|---|---|
| Point source | Stacks, dryers, boilers, blow-down steam vents, incinerator stacks |
| Area source | Effluent collection ponds, aeration basins, composting yards, stockpiles, landfill cells |
| Volume source | Storage buildings, livestock housing, sorting halls |
| Line source | Internal haul routes, open conveyors |
| Intermittent source | Material transfer, tank washing, compost pile turning |
Pollutants modelled: TSP, PM10, PM2.5, SO₂, NOx, CO, VOCs, odorous gases such as hydrogen sulphide (H₂S), ammonia (NH₃) and mercaptans, and total odour concentration in ou_E/m³.
Specialist capability: GEP stack height and building downwash
Wind flowing past a building creates a turbulent wake behind it that drags the plume down to ground level. This is building downwash, and it explains why extending a stack sometimes fails to reduce fence-line concentrations as expected.
Before downwash is assessed, the stack must be checked against the US EPA Good Engineering Practice criterion:
H_GEP = H_b + 1.5 L
where H_b is building height and L is the lesser of the building height or its width across the wind. If the actual stack height meets or exceeds H_GEP the plume clears the wake entirely; if not, the downwash equations apply.
RE-VEAL applies the PRIME algorithm (Plume Rise Model Enhancements, Schulman et al., 2000), the algorithm embedded in AERMOD itself, processes the building layout through BPIPPRM, and runs a paired comparison with and without buildings so it is clear which part of the ground-level concentration is caused by the structures rather than the emission rate.
| Why this matters: If the fence-line value is high because of building downwash, buying more abatement equipment will not help. The correct fix is to relocate the release point or change the stack height. Separating the two causes at the outset is where modelling saves the most capital. |
|---|
Odour modelling: why an hourly average is not enough
Every dispersion model computes concentrations as a one-hour average, but the human nose registers odour within seconds. Comparing hourly averages directly against an odour limit therefore always understates the impact: a plume with a low hourly mean can carry peaks strong enough to generate complaints.
RE-VEAL applies a peak-to-mean ratio to convert the one-hour average into a short-term peak concentration, choosing the method to fit the assignment.
| Method | Principle | Best suited to |
|---|---|---|
| PTMC — constant factor | A single multiplier across the domain; a factor of 4 is the common choice | Screening studies, flat terrain, a single source |
| PTMV — variable factor | Multiplier varies with Pasquill stability class A–F and distance from source | Submission-grade reports, sites with live complaints, multiple sources |
Results are reported in ou_E/m³ for direct comparison against the B.E. 2568 limits. The approach is supported by peer-reviewed work applying AERMOD to poultry and dairy barn odour and to refinery odour assessment.
Software and versions
Stating versions explicitly is one of the first things a reviewing authority checks, because EPA updates the suite annually and the 2024 revision of Appendix W took effect on 28 January 2025, with its one-year transition period closing on 29 November 2025.
| Program | Function | Version used |
|---|---|---|
| AERMOD | Core dispersion model | 26135 (released 9 July 2026) |
| AERMET | Meteorological preprocessor | 26135 |
| AERMAP | Terrain preprocessor | 24142 (the current regulatory version) |
| AERSURFACE | Surface characteristics preprocessor | 26135 |
| AERMINUTE | One-minute wind data preprocessor | 26135 |
| BPIPPRM | Building layout preprocessor for downwash | As bundled with AERMOD |
All work is performed on licensed AERMOD View, not a trial or freeware build, and the original input files are handed over so the client can audit or re-run the study later.
What the client needs to provide
The more complete the input data, the closer the result is to reality and the shorter the schedule. Where an item is missing, RE-VEAL can measure or source it.
1. Source data
- Stack height, inner and outer diameter
- Exit gas temperature, exit velocity and flow rate
- Coordinates of each stack (UTM or latitude/longitude)
- Operating hours per day and per year for each source
2. Stack emission test results
- The most recent stack test report, stating the analytical method used
- For odour work, odour concentration determined by triangular odour bag method
3. Layout and terrain
- Site plan with the position, footprint and height of every building in the relevant radius
- Property boundary and fence line
- Location of sensitive receptors: dwellings, schools, temples, hospitals, government offices
4. Meteorological data
- Hourly data from the nearest station, at least one full year, preferably more
- If unavailable, RE-VEAL sources it from Thai Meteorological Department stations or international datasets
| A common pitfall: Substituting meteorological data from another province because the study area has no station limits the result to screening use only; it should not be submitted to a regulator as a compliance report. RE-VEAL flags this status before work begins, every time. |
|---|
Deliverables
- Full modelling report stating assumptions, input data, program versions and the limitations of the study.
- Isopleth contour maps by pollutant and averaging period, both wide-view and zoomed on the maximum-concentration area.
- Summary tables of peak concentrations at the fence line and at each sensitive receptor, benchmarked against the applicable limits.
- Wind rose for the station used, with the data source and period stated.
- Building downwash analysis comparing the with-buildings and without-buildings cases, plus a GEP check for every stack.
- Agreed scenario runs — a new source, an abated source, a different stack height — to support the investment decision.
- The original model input files, so the client can audit and re-run the study independently.
- A summary presentation for use with management, regulators and the community.
Process and schedule
| Phase | Activity | Indicative duration |
|---|---|---|
| 1 · Survey and data collection | Site visit, building layout check, stack and emission data, meteorological data sourcing | 1–2 weeks |
| 2 · Emission rates and model build | Convert test results to emission rates, classify sources, run AERMET, AERMAP and BPIPPRM | 1–2 weeks |
| 3 · Model runs and analysis | Base case and comparison scenarios, sanity checks, downwash analysis | 1–2 weeks |
| 4 · Reporting and presentation | Report writing, map production, presentation and Q&A | 1–2 weeks |
Four to eight weeks in total, depending on the number of sources, the number of comparison scenarios and the readiness of the input data. Where the schedule is tight, screening results can be delivered as a separate early milestone.
What modelling cannot replace
We state this before work begins, every time, because it is the issue that gets reports sent back.
- For odour, modelling is not a legal reference method. Clause 8 of the B.E. 2568 regulation requires odour concentration to be determined by sensory testing under criteria published by the Minister, and permits other methods only once a further notification is issued — which has not yet happened.
- Output is only as good as input. Where emission rates are estimated rather than measured, or meteorology is borrowed from another area, results can prioritise action but should not be used to demonstrate compliance.
- AERMOD has a defined envelope. It suits ranges up to roughly 50 km under steady-state assumptions. For highly complex terrain, longer ranges or extended calm conditions, CALPUFF should be considered alongside it — which RE-VEAL also advises on and performs.
RE-VEAL therefore uses modelling to plan and prioritise, and always confirms the outcome with sampling and reference-method analysis, both of which we provide in-house.
Who this service is for
- Plants preparing an EIA or EHIA, or a monitoring-compliance report
- Plants expanding capacity, adding a stack or installing a boiler, that need the impact quantified before committing capital
- Plants facing community complaints about odour or dust that need engineering evidence to support their response
- Factories in the 24-entry schedule of the B.E. 2568 odour regulation, particularly the newly added rubber factories
- Livestock farms and animal husbandry premises subject to the MNRE notification
- Local authorities needing neutral evidence to mediate disputes between plants and communities
Getting started
Send us the basics: type of operation, number of sources, and why the study is needed. Our engineers will scope the work, tell you what further data is required, and return a fee proposal and schedule within three working days, at no cost at that stage.
Free initial consultation · Request a proposal